- Matplotlib Basics
- Matplotlib - Home
- Matplotlib - Introduction
- Matplotlib - Vs Seaborn
- Matplotlib - Environment Setup
- Matplotlib - Anaconda distribution
- Matplotlib - Jupyter Notebook
- Matplotlib - Pyplot API
- Matplotlib - Simple Plot
- Matplotlib - Saving Figures
- Matplotlib - Markers
- Matplotlib - Figures
- Matplotlib - Styles
- Matplotlib - Legends
- Matplotlib - Colors
- Matplotlib - Colormaps
- Matplotlib - Colormap Normalization
- Matplotlib - Choosing Colormaps
- Matplotlib - Colorbars
- Matplotlib - Text
- Matplotlib - Text properties
- Matplotlib - Subplot Titles
- Matplotlib - Images
- Matplotlib - Image Masking
- Matplotlib - Annotations
- Matplotlib - Arrows
- Matplotlib - Fonts
- Matplotlib - What are Fonts?
- Setting Font Properties Globally
- Matplotlib - Font Indexing
- Matplotlib - Font Properties
- Matplotlib - Scales
- Matplotlib - Linear and Logarthmic Scales
- Matplotlib - Symmetrical Logarithmic and Logit Scales
- Matplotlib - LaTeX
- Matplotlib - What is LaTeX?
- Matplotlib - LaTeX for Mathematical Expressions
- Matplotlib - LaTeX Text Formatting in Annotations
- Matplotlib - PostScript
- Enabling LaTex Rendering in Annotations
- Matplotlib - Mathematical Expressions
- Matplotlib - Animations
- Matplotlib - Artists
- Matplotlib - Styling with Cycler
- Matplotlib - Paths
- Matplotlib - Path Effects
- Matplotlib - Transforms
- Matplotlib - Ticks and Tick Labels
- Matplotlib - Radian Ticks
- Matplotlib - Dateticks
- Matplotlib - Tick Formatters
- Matplotlib - Tick Locators
- Matplotlib - Axis Ranges
- Matplotlib - Axis Scales
- Matplotlib - Axis Ticks
- Matplotlib - Formatting Axes
- Matplotlib - Axes Class
- Matplotlib - Twin Axes
- Matplotlib - Figure Class
- Matplotlib - Multiplots
- Matplotlib - Grids
- Matplotlib - Object-oriented Interface
- Matplotlib - PyLab module
- Matplotlib - Subplots() Function
- Matplotlib - Subplot2grid() Function
- Matplotlib - Anchored Artists
- Matplotlib - Manual Contour
- Matplotlib - Coords Report
- Matplotlib - AGG filter
- Matplotlib - Ribbon Box
- Matplotlib - Fill Spiral
- Matplotlib - Findobj Demo
- Matplotlib - Hyperlinks
- Matplotlib - Image Thumbnail
- Matplotlib - Plotting with Keywords
- Matplotlib - Create Logo
- Matplotlib - Multipage PDF
- Matplotlib - Multiprocessing
- Matplotlib - Print Stdout
- Matplotlib - Compound Path
- Matplotlib - Sankey Class
- Matplotlib - MRI with EEG
- Matplotlib - Stylesheets
- Matplotlib - Background Colors
- Matplotlib - Basemap
- Matplotlib Event Handling
- Matplotlib - Event Handling
- Matplotlib - Close Event
- Matplotlib - Mouse Move
- Matplotlib - Click Events
- Matplotlib - Scroll Event
- Matplotlib - Keypress Event
- Matplotlib - Pick Event
- Matplotlib - Looking Glass
- Matplotlib - Path Editor
- Matplotlib - Poly Editor
- Matplotlib - Timers
- Matplotlib - Viewlims
- Matplotlib - Zoom Window
- Matplotlib Plotting
- Matplotlib - Bar Graphs
- Matplotlib - Histogram
- Matplotlib - Pie Chart
- Matplotlib - Scatter Plot
- Matplotlib - Box Plot
- Matplotlib - Violin Plot
- Matplotlib - Contour Plot
- Matplotlib - 3D Plotting
- Matplotlib - 3D Contours
- Matplotlib - 3D Wireframe Plot
- Matplotlib - 3D Surface Plot
- Matplotlib - Quiver Plot
- Matplotlib Useful Resources
- Matplotlib - Quick Guide
- Matplotlib - Useful Resources
- Matplotlib - Discussion
Matplotlib - Colormap Normalization
The term normalization refers to the rescaling of real values to a common range, such as between 0 and 1. It is commonly used as per−processing technique in data processing and analysis.
Colormap Normalization in Matplotlib
In this context, Normalization is the process of mapping data values to colors. The Matplotlib library provides various normalization techniques, including −
Logarithmic
Centered
Symmetric logarithmic
Power-law
Discrete bounds
Two-slope
Custom normalization
Linear Normalization
The default behavior in Matplotlib is to linearly map colors based on data values within a specified range. This range is typically defined by the minimum (vmin) and maximum (vmax) values of the matplotlib.colors.Normalize() instance arguments.
This mapping occurs in two steps, first normalizing the input data to the [0, 1] range and then mapping ont the indices in the colormap.
Example
This example demonstrates Matplotlib's linear normalization process using the Normalize() class from the matplotlib.colors module.
import matplotlib as mpl
from matplotlib.colors import Normalize

# Creates a Normalize object with a specified range
norm = Normalize(vmin=-1, vmax=1)

# Normalizing a value
normalized_value = norm(0)

# Display the normalized value
print('Normalized Value', normalized_value)
Output
On executing the above code we will get the following output −
Normalized Value: 0.5
While linear normalization is the default and often suitable, there are scenarios where non-linear mappings can be more informative or visually appealing.
Logarithmic Normalization
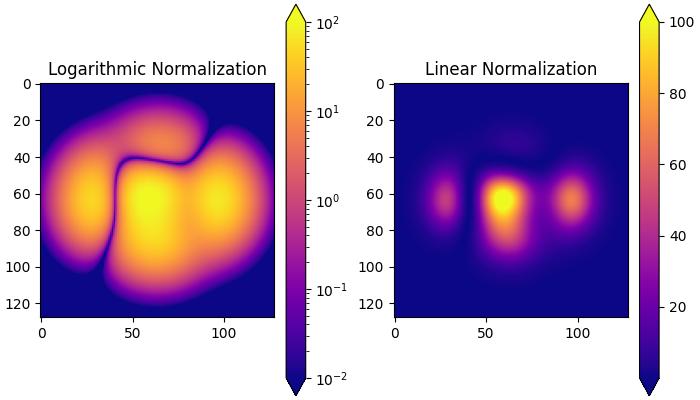
It is a common transformation that takes the logarithm (base-10) of the data. This is useful when displaying changes across disparate scales. The colors.LogNorm() class is used for this normalization.
Example
In this example, two subplots are created to demonstrate the difference between logarithmic and linear normalization transformations.
import matplotlib.pyplot as plt
import numpy as np
from matplotlib import colors

# Sample Data
X, Y = np.meshgrid(np.linspace(-3, 3, 128), np.linspace(-3, 3, 128))
Z = (1 - X/2 + X**5 + Y**3) * np.exp(-X**2 - Y**2)

# Create subplots
fig, ax = plt.subplots(1, 2, figsize=(7,4), layout='constrained')

# Logarithmic Normalization
pc = ax[0].imshow(Z**2 * 100, cmap='plasma',
   norm=colors.LogNorm(vmin=0.01, vmax=100))
fig.colorbar(pc, ax=ax[0], extend='both')
ax[0].set_title('Logarithmic Normalization')

# Linear Normalization
pc = ax[1].imshow(Z**2 * 100, cmap='plasma',
   norm=colors.Normalize(vmin=0.01, vmax=100))
fig.colorbar(pc, ax=ax[1], extend='both')
ax[1].set_title('Linear Normalization')
plt.show()
Output
On executing the above code we will get the following output −

Centered Normalization
When data is symmetrical around a center (e.g., positive and negative anomalies around 0), the colors.CenteredNorm() class can be used. It automatically maps the center to 0.5, and the point with the largest deviation from the center to 1.0 or 0.0, depending on its value.
Example
This example compares the effects of default linear normalization and centered normalization (CenteredNorm()) on the dataset using a coolwarm colormap.
import matplotlib.pyplot as plt
import numpy as np
from matplotlib import colors, cm

X, Y = np.meshgrid(np.linspace(-3, 3, 128), np.linspace(-3, 3, 128))
Z = (1 - X/2 + X**5 + Y**3) * np.exp(-X**2 - Y**2)

# select a divergent colormap
cmap = cm.coolwarm

# Create subplots
fig, ax = plt.subplots(1, 2, figsize=(7,4), layout='constrained')

# Default Linear Normalization
pc = ax[0].pcolormesh(Z, cmap=cmap)
fig.colorbar(pc, ax=ax[0])
ax[0].set_title('Normalize')

# Centered Normalization
pc = ax[1].pcolormesh(Z, norm=colors.CenteredNorm(), cmap=cmap)
fig.colorbar(pc, ax=ax[1])
ax[1].set_title('CenteredNorm()')

plt.show()
Output
On executing the above code we will get the following output −

Symmetric Logarithmic Normalization
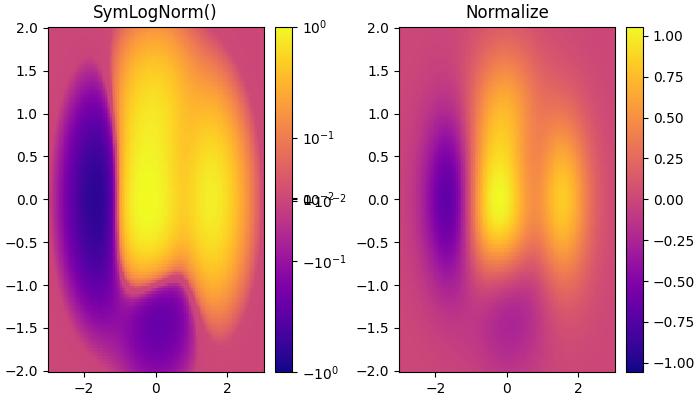
If data may contain both positive and negative values, and logarithmic scaling is desired for both. The colors.SymLogNorm() Class in Matplotlib is designed for such cases. This normalization maps negative numbers logarithmically to smaller values, and positive numbers to larger values.
Example
Here is an example that uses the colors.SymLogNorm() Class to transform the data.
import matplotlib.pyplot as plt
import numpy as np
from matplotlib import colors, cm

X, Y = np.mgrid[-3:3:complex(0, 128), -2:2:complex(0, 128)]
Z = (1 - X/2 + X**5 + Y**3) * np.exp(-X**2 - Y**2)

# Create subplots
fig, ax = plt.subplots(1, 2, figsize=(7, 4), layout='constrained')

# Symmetric Logarithmic Normalization
pcm = ax[0].pcolormesh(X, Y, Z,
   norm=colors.SymLogNorm(linthresh=0.03, linscale=0.03,vmin=-1.0, vmax=1.0, base=10),
   cmap='plasma', shading='auto')
fig.colorbar(pcm, ax=ax[0])
ax[0].set_title('SymLogNorm()')

# Default Linear Normalization
pcm = ax[1].pcolormesh(X, Y, Z, cmap='plasma', vmin=-np.max(Z), shading='auto')
fig.colorbar(pcm, ax=ax[1])
ax[1].set_title('Normalize')

plt.show()
Output
On executing the above code we will get the following output −

Power-law Normalization
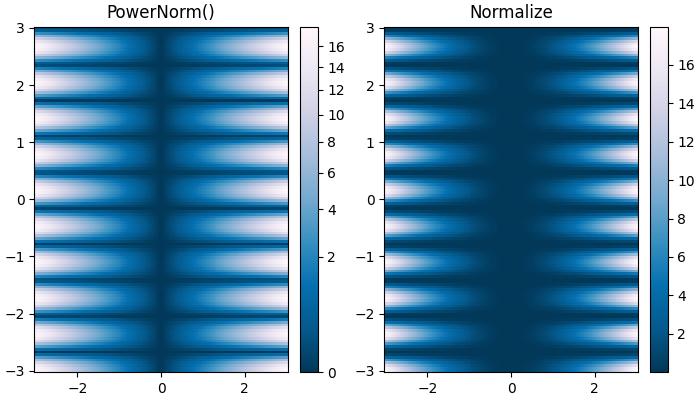
This normalization is useful to remap colors onto a power-law relationship using the colors.PowerNorm() class.
Example
Here is an example that compares the power-law (colors.PowerNorm()) and linear normalizations.
import matplotlib.pyplot as plt
import numpy as np
from matplotlib import colors, cm

X, Y = np.meshgrid(np.linspace(-3, 3, 128), np.linspace(-3, 3, 128))
Z = (1 + np.sin(Y * 10.)) * X**2

# Create subplots
fig, ax = plt.subplots(1, 2, figsize=(7, 4), layout='constrained')

# Power-law Normalization
pcm = ax[0].pcolormesh(X, Y, Z, norm=colors.PowerNorm(gamma=0.5),
   cmap='PuBu_r', shading='auto')
fig.colorbar(pcm, ax=ax[0])
ax[0].set_title('PowerNorm()')

# Default Linear Normalization
pcm = ax[1].pcolormesh(X, Y, Z, cmap='PuBu_r', shading='auto')
fig.colorbar(pcm, ax=ax[1])
ax[1].set_title('Normalize')

plt.show()
Output
On executing the above code we will get the following output −

Discrete Bounds Normalization
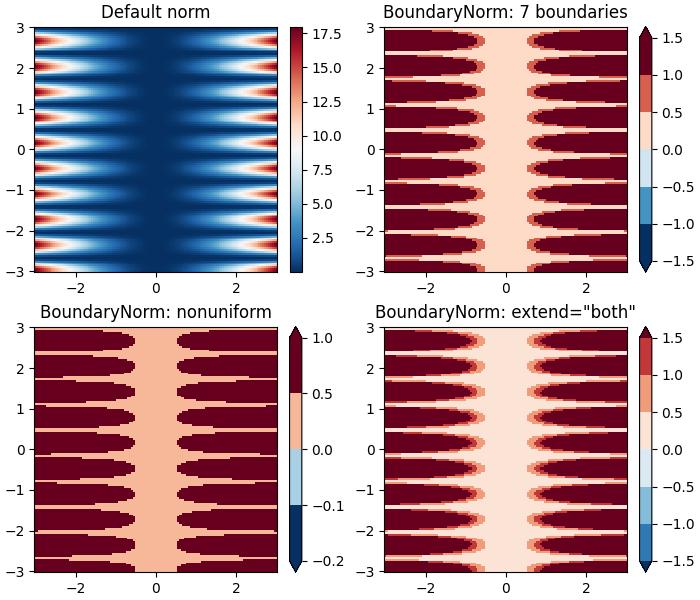
Another normalization provided by Matplotlib is colors.BoundaryNorm. This is particularly useful when data needs to be mapped between specified boundaries with linearly distributed colors.
Example
This example demonstrates the use of the Discrete Bounds normalization using the BoundaryNorm() class to create different visual effects when displaying a colormesh plot.
import matplotlib.pyplot as plt
import numpy as np
import matplotlib.colors as colors

X, Y = np.meshgrid(np.linspace(-3, 3, 128), np.linspace(-3, 3, 128))
Z = (1 + np.sin(Y * 10.)) * X**2

fig, ax = plt.subplots(2, 2, figsize=(7, 6), layout='constrained')
ax = ax.flatten()

# Default norm:
pcm = ax[0].pcolormesh(X, Y, Z, cmap='RdBu_r')
fig.colorbar(pcm, ax=ax[0], orientation='vertical')
ax[0].set_title('Default norm')

# Even bounds give a contour-like effect:
bounds = np.linspace(-1.5, 1.5, 7)
norm = colors.BoundaryNorm(boundaries=bounds, ncolors=256)
pcm = ax[1].pcolormesh(X, Y, Z, norm=norm, cmap='RdBu_r')
fig.colorbar(pcm, ax=ax[1], extend='both', orientation='vertical')
ax[1].set_title('BoundaryNorm: 7 boundaries')

# Bounds may be unevenly spaced:
bounds = np.array([-0.2, -0.1, 0, 0.5, 1])
norm = colors.BoundaryNorm(boundaries=bounds, ncolors=256)
pcm = ax[2].pcolormesh(X, Y, Z, norm=norm, cmap='RdBu_r')
fig.colorbar(pcm, ax=ax[2], extend='both', orientation='vertical')
ax[2].set_title('BoundaryNorm: nonuniform')

# With out-of-bounds colors:
bounds = np.linspace(-1.5, 1.5, 7)
norm = colors.BoundaryNorm(boundaries=bounds, ncolors=256, extend='both')
pcm = ax[3].pcolormesh(X, Y, Z, norm=norm, cmap='RdBu_r')
# The colorbar inherits the "extend" argument from BoundaryNorm.
fig.colorbar(pcm, ax=ax[3], orientation='vertical')
ax[3].set_title('BoundaryNorm: extend="both"')

plt.show()
Output
On executing the above code we will get the following output −

The TwoSlopeNorm normalization is used when different colormaps on either side of a conceptual center point, it is commonly used in scenarios such as topographic maps where land and ocean have different elevation and depth ranges.
When built-in norms fall short, then the FuncNorm enables custom normalization using arbitrary functions.
Additionally, Matplotlib supports crafting custom normalizations like MidpointNormalize, useful for defining mappings in specialized visualizations.
These tools provide flexibility in adapting color representations to diverse data and visualization requirements.
To Continue Learning Please Login