
- Matplotlib Basics
- Matplotlib - Home
- Matplotlib - Introduction
- Matplotlib - Vs Seaborn
- Matplotlib - Environment Setup
- Matplotlib - Anaconda distribution
- Matplotlib - Jupyter Notebook
- Matplotlib - Pyplot API
- Matplotlib - Simple Plot
- Matplotlib - Saving Figures
- Matplotlib - Markers
- Matplotlib - Figures
- Matplotlib - Styles
- Matplotlib - Legends
- Matplotlib - Colors
- Matplotlib - Colormaps
- Matplotlib - Colormap Normalization
- Matplotlib - Choosing Colormaps
- Matplotlib - Colorbars
- Matplotlib - Text
- Matplotlib - Text properties
- Matplotlib - Subplot Titles
- Matplotlib - Images
- Matplotlib - Image Masking
- Matplotlib - Annotations
- Matplotlib - Arrows
- Matplotlib - Fonts
- Matplotlib - What are Fonts?
- Setting Font Properties Globally
- Matplotlib - Font Indexing
- Matplotlib - Font Properties
- Matplotlib - Scales
- Matplotlib - Linear and Logarthmic Scales
- Matplotlib - Symmetrical Logarithmic and Logit Scales
- Matplotlib - LaTeX
- Matplotlib - What is LaTeX?
- Matplotlib - LaTeX for Mathematical Expressions
- Matplotlib - LaTeX Text Formatting in Annotations
- Matplotlib - PostScript
- Enabling LaTex Rendering in Annotations
- Matplotlib - Mathematical Expressions
- Matplotlib - Animations
- Matplotlib - Artists
- Matplotlib - Styling with Cycler
- Matplotlib - Paths
- Matplotlib - Path Effects
- Matplotlib - Transforms
- Matplotlib - Ticks and Tick Labels
- Matplotlib - Radian Ticks
- Matplotlib - Dateticks
- Matplotlib - Tick Formatters
- Matplotlib - Tick Locators
- Matplotlib - Axis Ranges
- Matplotlib - Axis Scales
- Matplotlib - Axis Ticks
- Matplotlib - Formatting Axes
- Matplotlib - Axes Class
- Matplotlib - Twin Axes
- Matplotlib - Figure Class
- Matplotlib - Multiplots
- Matplotlib - Grids
- Matplotlib - Object-oriented Interface
- Matplotlib - PyLab module
- Matplotlib - Subplots() Function
- Matplotlib - Subplot2grid() Function
- Matplotlib - Anchored Artists
- Matplotlib - Manual Contour
- Matplotlib - Coords Report
- Matplotlib - AGG filter
- Matplotlib - Ribbon Box
- Matplotlib - Fill Spiral
- Matplotlib - Findobj Demo
- Matplotlib - Hyperlinks
- Matplotlib - Image Thumbnail
- Matplotlib - Plotting with Keywords
- Matplotlib - Create Logo
- Matplotlib - Multipage PDF
- Matplotlib - Multiprocessing
- Matplotlib - Print Stdout
- Matplotlib - Compound Path
- Matplotlib - Sankey Class
- Matplotlib - MRI with EEG
- Matplotlib - Stylesheets
- Matplotlib - Background Colors
- Matplotlib - Basemap
- Matplotlib Event Handling
- Matplotlib - Event Handling
- Matplotlib - Close Event
- Matplotlib - Mouse Move
- Matplotlib - Click Events
- Matplotlib - Scroll Event
- Matplotlib - Keypress Event
- Matplotlib - Pick Event
- Matplotlib - Looking Glass
- Matplotlib - Path Editor
- Matplotlib - Poly Editor
- Matplotlib - Timers
- Matplotlib - Viewlims
- Matplotlib - Zoom Window
- Matplotlib Plotting
- Matplotlib - Bar Graphs
- Matplotlib - Histogram
- Matplotlib - Pie Chart
- Matplotlib - Scatter Plot
- Matplotlib - Box Plot
- Matplotlib - Violin Plot
- Matplotlib - Contour Plot
- Matplotlib - 3D Plotting
- Matplotlib - 3D Contours
- Matplotlib - 3D Wireframe Plot
- Matplotlib - 3D Surface Plot
- Matplotlib - Quiver Plot
- Matplotlib Useful Resources
- Matplotlib - Quick Guide
- Matplotlib - Useful Resources
- Matplotlib - Discussion
Matplotlib - Colormaps
Colormap (often called a color table or a palette), is a set of colors arranged in a specific order, it is used to visually represent data. See the below image for reference −
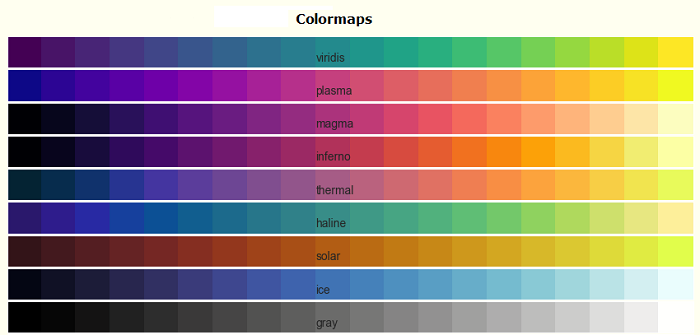
In the context of Matplotlib, colormaps play a crucial role in mapping numerical values to colors in various plots. Matplotlib offers built-in colormaps and external libraries like Palettable, or even it allows us to create and manipulate our own colormaps.
Colormaps in Matplotlib
Matplotlib provides number of built-in colormaps like 'viridis' or 'copper', those can be accessed through matplotlib.colormaps container. It is an universal registry instance, which returns a colormap object.
Example
Following is the example that gets the list of all registered colormaps in matplotlib.
from matplotlib import colormaps
print(list(colormaps))
Output
['magma', 'inferno', 'plasma', 'viridis', 'cividis', 'twilight', 'twilight_shifted', 'turbo', 'Blues', 'BrBG', 'BuGn', 'BuPu', 'CMRmap', 'GnBu', 'Greens', 'Greys', 'OrRd', 'Oranges', 'PRGn', 'PiYG', 'PuBu', 'PuBuGn', 'PuOr', 'PuRd', 'Purples', 'RdBu', 'RdGy', 'RdPu', 'RdYlBu', 'RdYlGn', 'Reds', 'Spectral', 'Wistia', 'YlGn', 'YlGnBu', 'YlOrBr', 'YlOrRd', 'afmhot', 'autumn', 'binary', 'bone', 'brg', 'bwr', 'cool', 'coolwarm', 'copper', 'cubehelix', 'flag', 'gist_earth', 'gist_gray', 'gist_heat', 'gist_ncar', 'gist_rainbow', 'gist_stern', 'gist_yarg', 'gnuplot', 'gnuplot2', 'gray', 'hot', 'hsv', 'jet', 'nipy_spectral', 'ocean', …]
Accessing Colormaps and their Values
You can get a named colormap using matplotlib.colormaps['viridis'], and it returns a colormap object. After obtaining a colormap object, you can access its values by resampling the colormap. In this case, viridis is a colormap object, when passed a float between 0 and 1, it returns an RGBA value from the colormap.
Example
Here is an example that accessing the colormap values.
import matplotlib
viridis = matplotlib.colormaps['viridis'].resampled(8)
print(viridis(0.37))
Output
(0.212395, 0.359683, 0.55171, 1.0)
Creating and Manipulating Colormaps
Matplotlib provides the flexibility to create or manipulate your own colormaps. This process involves using the classes ListedColormap or LinearSegmentedColormap.
Creating Colormaps with ListedColormap
The ListedColormaps class is useful for creating custom colormaps by providing a list or array of color specifications. You can use this to build a new colormap using color names or RGB values.
Example
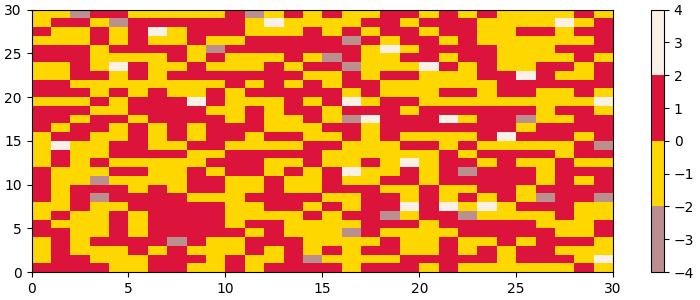
The following example demonstrates how to create custom colormaps using the ListedColormap class with specific color names.
import matplotlib as mpl
from matplotlib.colors import ListedColormap
import matplotlib.pyplot as plt
import numpy as np

# Creating a ListedColormap from color names
colormaps = [ListedColormap(['rosybrown', 'gold', "crimson", "linen"])]

# Plotting examples
np.random.seed(19680801)
data = np.random.randn(30, 30)
n = len(colormaps)

fig, axs = plt.subplots(1, n, figsize=(7, 3), layout='constrained', squeeze=False)
for [ax, cmap] in zip(axs.flat, colormaps):
   psm = ax.pcolormesh(data, cmap=cmap, rasterized=True, vmin=-4, vmax=4)
   fig.colorbar(psm, ax=ax)

plt.show()
Output
On executing the above program, you will get the following output −
Creating Colormaps with LinearSegmentedColormap
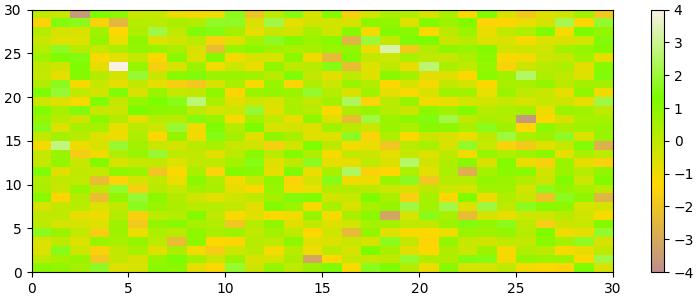
The LinearSegmentedColormap class allows more control by specifying anchor points and their corresponding colors. This enables the creation of colormaps with interpolated values.
Example
The following example demonstrates how to create custom colormaps using the LinearSegmentedColormap class with a specific list of color names.
import matplotlib as mpl
from matplotlib.colors import LinearSegmentedColormap
import matplotlib.pyplot as plt
import numpy as np

# Creating a LinearSegmentedColormap from a list
colors = ["rosybrown", "gold", "lawngreen", "linen"]
cmap_from_list = [LinearSegmentedColormap.from_list("SmoothCmap", colors)]

# Plotting examples
np.random.seed(19680801)
data = np.random.randn(30, 30)
n = len(cmap_from_list)

fig, axs = plt.subplots(1, n, figsize=(7, 3), layout='constrained', squeeze=False)
for [ax, cmap] in zip(axs.flat, cmap_from_list):
   psm = ax.pcolormesh(data, cmap=cmap, rasterized=True, vmin=-4, vmax=4)
   fig.colorbar(psm, ax=ax)

plt.show()
Output
On executing the above program, you will get the following output −
Reversing Colormaps
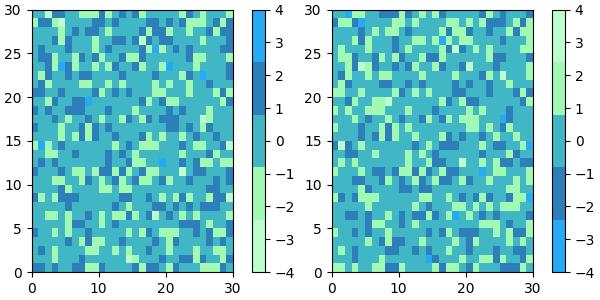
Reversing a colormap can be done by using the colormap.reversed() method. This creates a new colormap that is the reversed version of the original colormap.
Example
This example generates side-by-side visualizations of the original colormap and its reversed version.
from matplotlib.colors import ListedColormap
import matplotlib.pyplot as plt
import numpy as np

# Define a list of color values in hexadecimal format
colors = ["#bbffcc", "#a1fab4", "#41b6c4", "#2c7fb8", "#25abf4"]

# Create a ListedColormap with the specified colors
my_cmap = ListedColormap(colors, name="my_cmap")

# Create a reversed version of the colormap
my_cmap_r = my_cmap.reversed()

# Define a helper function to plot data with associated colormap
def plot_examples(colormaps):
   np.random.seed(19680801)
   data = np.random.randn(30, 30)
   n = len(colormaps)
   fig, axs = plt.subplots(1, n, figsize=(n * 2 + 2, 3), layout='constrained', squeeze=False)

   for [ax, cmap] in zip(axs.flat, colormaps):
      psm = ax.pcolormesh(data, cmap=cmap, rasterized=True, vmin=-4, vmax=4)
      fig.colorbar(psm, ax=ax)
   plt.show()

# Plot the original and reversed colormaps
plot_examples([my_cmap, my_cmap_r])
Output
On executing the above program, you will get the following output −
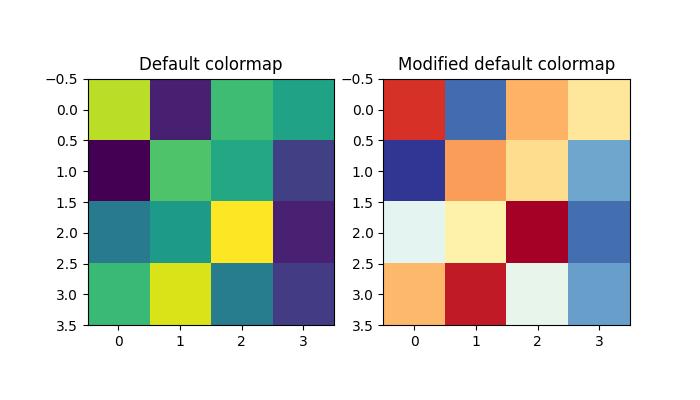
Changing the default colormap
To change the default colormap for all subsequent plots, you can use mpl.rc() to modify the default colormap setting.
Example
Here is an example that changes the default colormap to RdYlBu_r by modifying the global Matplotlib settings like mpl.rc('image', cmap='RdYlBu_r').
import numpy as np
from matplotlib import pyplot as plt
import matplotlib as mpl

# Generate random data
data = np.random.rand(4, 4)

# Create a figure with two subplots
fig, (ax1, ax2) = plt.subplots(1, 2, figsize=(7, 4))

# Plot the first subplot with the default colormap
ax1.imshow(data)
ax1.set_title("Default colormap")

# Set the default colormap globally to 'RdYlBu_r'
mpl.rc('image', cmap='RdYlBu_r')

# Plot the modified default colormap
ax2.imshow(data)
ax2.set_title("Modified default colormap")

# Display the figure with both subplots
plt.show()
Output
On executing the above code we will get the following output −
Plotting Lines with Colors through Colormap
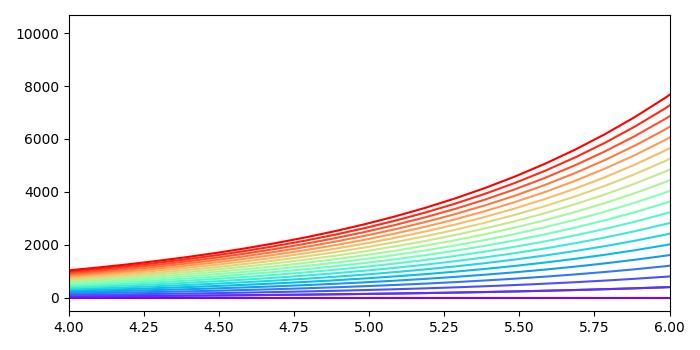
To plot multiple lines with different colors through a colormap, you can utilize Matplotlib's plot() function along with a colormap to assign different colors to each line.
Example
The following example plot multiple lines by iterating over a range and plotting each line with a different color from the colormap using the color parameter in the plot() function.
import numpy as np
import matplotlib.pyplot as plt

plt.rcParams["figure.figsize"] = [7.00, 3.50]
plt.rcParams["figure.autolayout"] = True

# Generate x and y data
x = np.linspace(0, 2 * np.pi, 64)
y = np.exp(x)

# Plot the initial line
plt.plot(x, y)

# Define the number of lines and create a colormap
n = 20
colors = plt.cm.rainbow(np.linspace(0, 1, n))

# Plot multiple lines with different colors using a loop
for i in range(n):
   plt.plot(x, i * y, color=colors[i])

plt.xlim(4, 6)
plt.show()
Output
On executing the above code we will get the following output −
To Continue Learning Please Login